TEXTONICS
Year: 2015 - 2016
Client: Certain Measures
Team: Andrew Witt, Tobias Nolte, James Yamada
Authors: Vitruvius, Christopher Alexander, Robert Venturi, Bernard Cache, Greg Lynn
Partners: Harvard Geometry Lab
Client: Certain Measures
Team: Andrew Witt, Tobias Nolte, James Yamada
Authors: Vitruvius, Christopher Alexander, Robert Venturi, Bernard Cache, Greg Lynn
Partners: Harvard Geometry Lab
Textonics maps and visualizes the deep structure not of the visual artifacts of architecture but instead the rhetorical ones: pivotal theoretical texts.
We tapped research in a certain domain of computational linguistics that is concerned with the classification of sentiment. Researchers survey hundreds or thousands of people rank tens of thousands of words relative to their positive or negative content, and how strong that emotional content is. We used these datasets to scan a series of architectural texts and unpack the tone of those texts as a structured image.
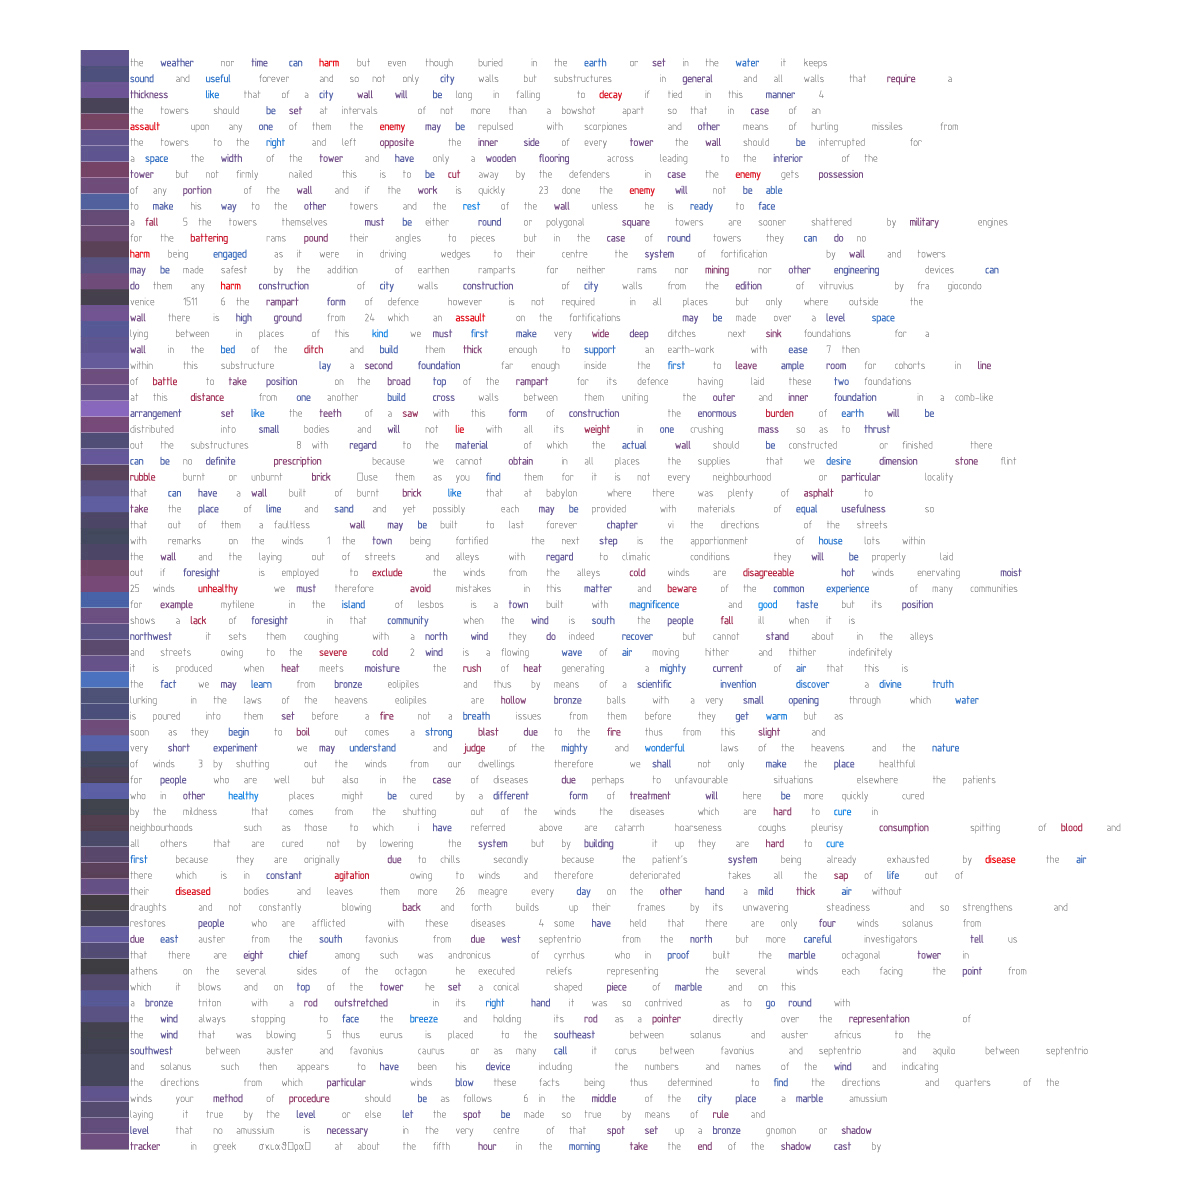
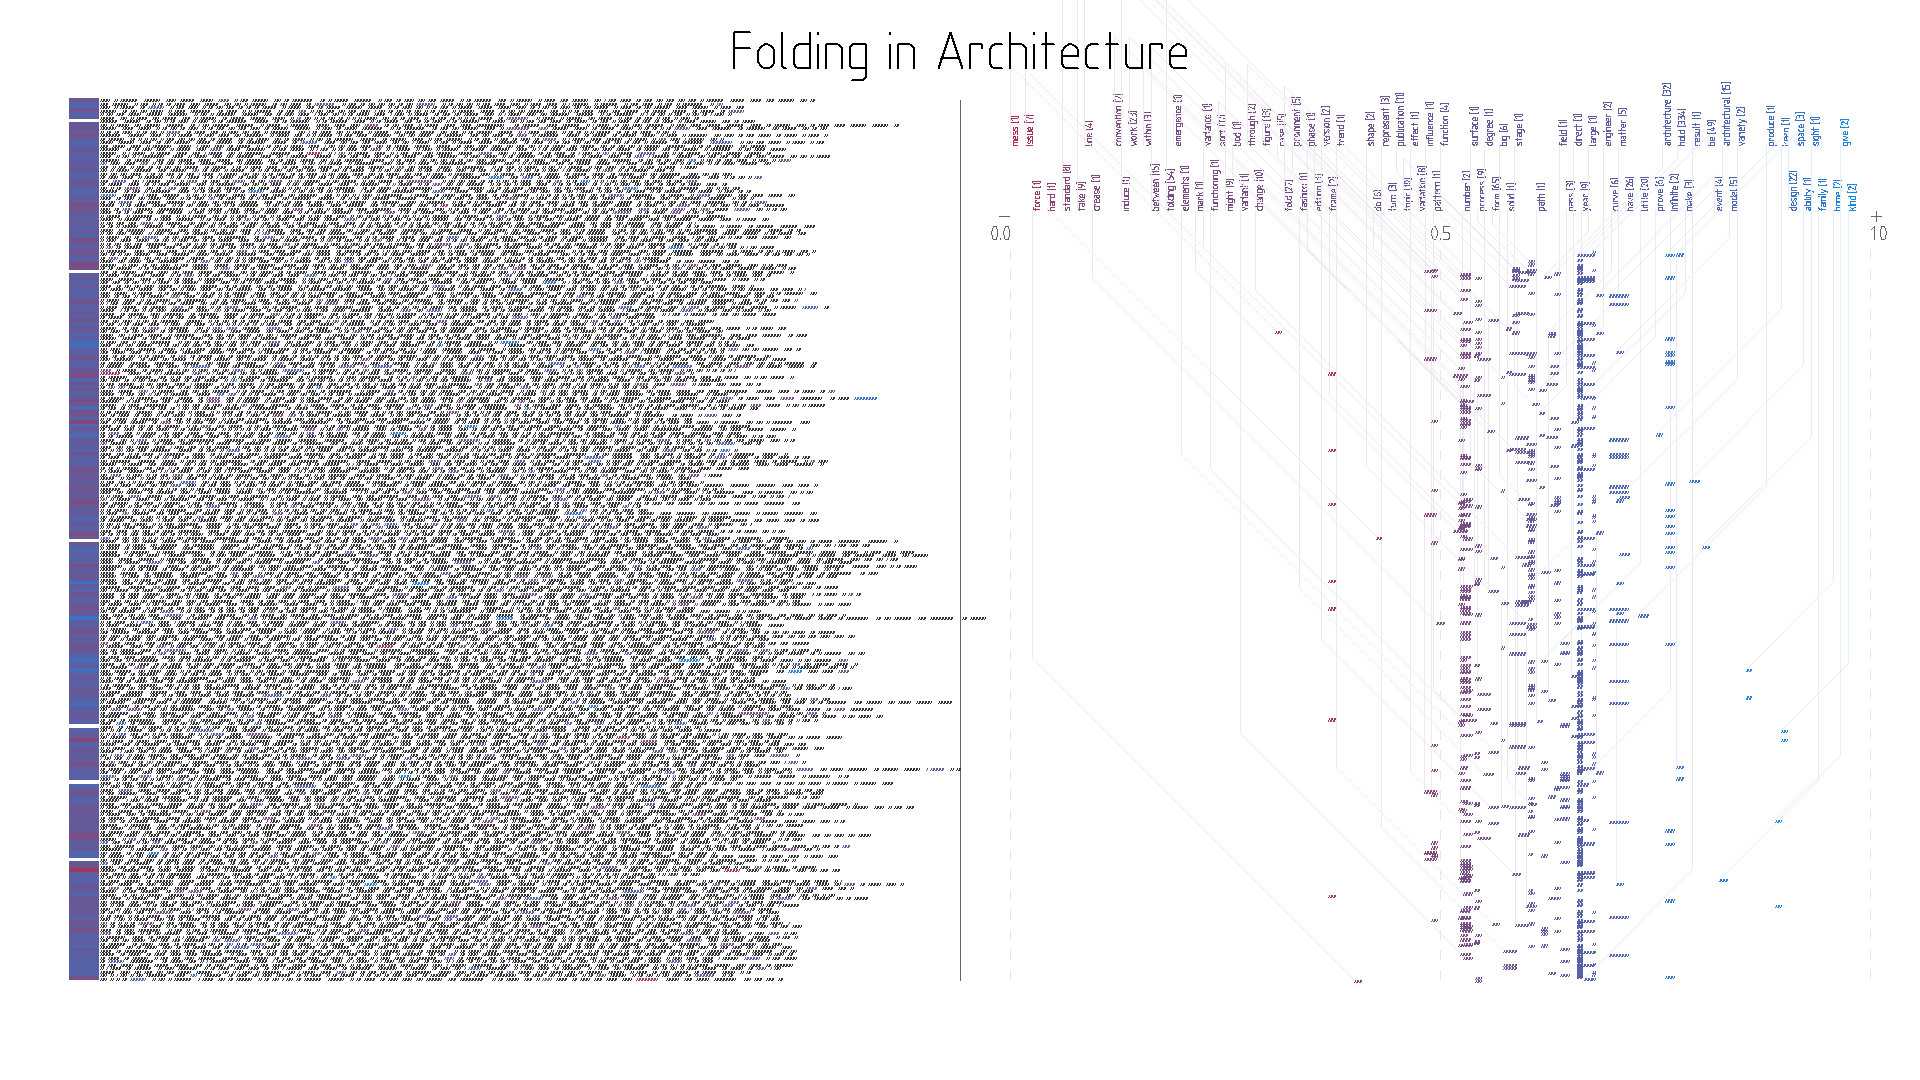
The images show the actual text at left and a "spectrum" diagram of tone at right. The rightmost blue region indicates a section of the text which is highly positive in tone, the leftmost red a highly negative tone. The specific words with greatest frequency read across the top. We did extensive cross-checking for synonyms and normalized other factors to make these spectra comparable. Ultimately there is an opportunity to apply methods of computational linguistics to the entire discourse of architecture, teasing out the structural ties that bind its rhetorical conversation.
How It Works
Step 1
![]()
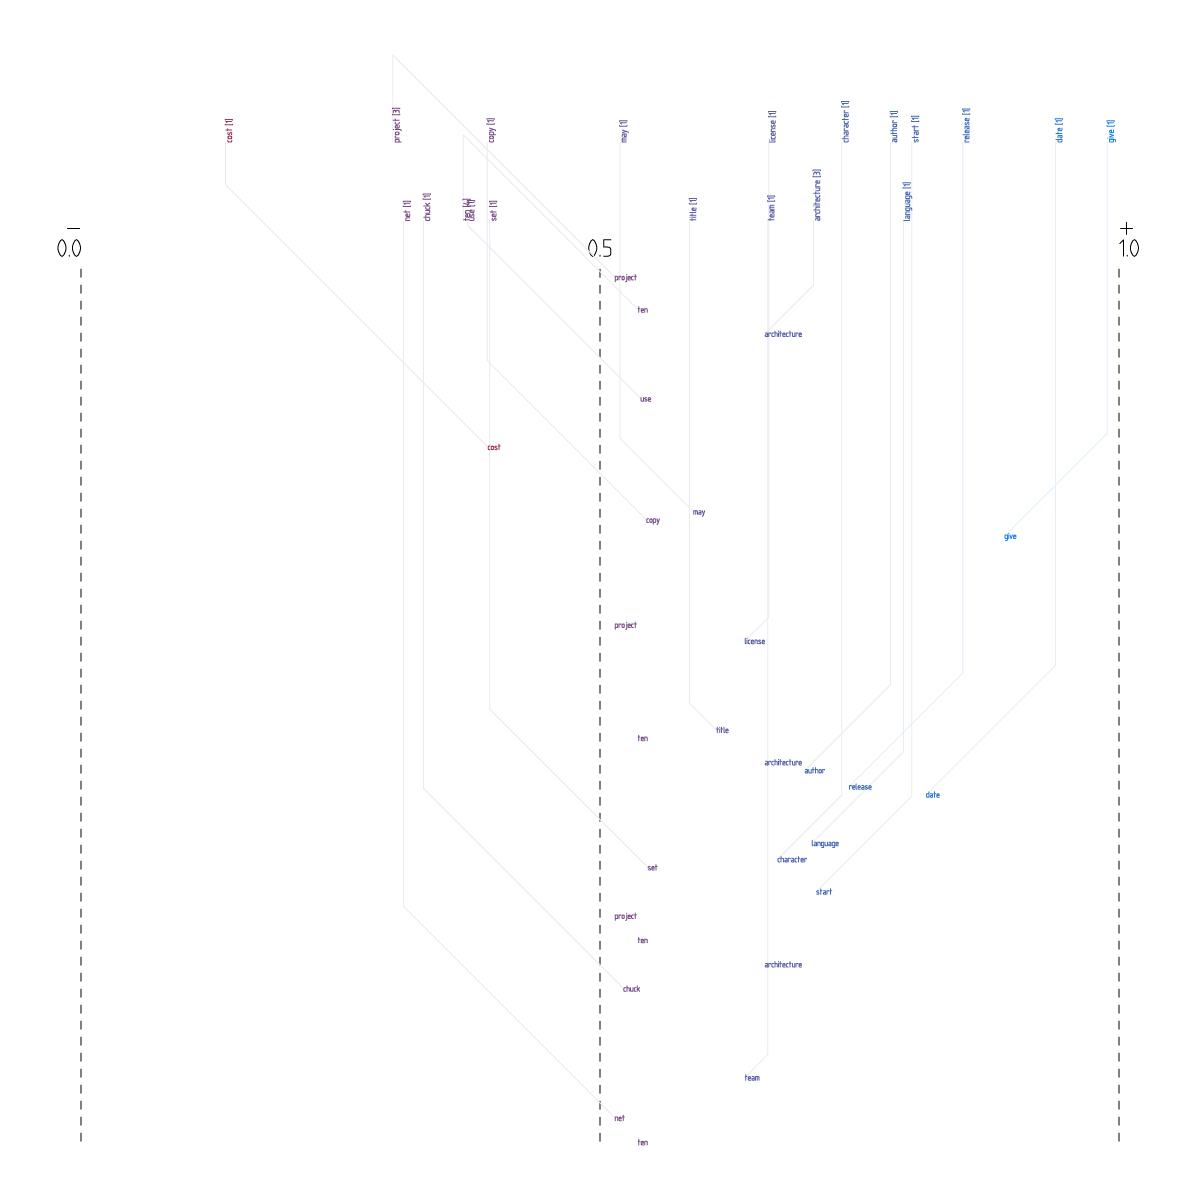
Our software reads through a text corpus and attempts to match each word to a database of existing valence norms.

Our software reads through a text corpus and attempts to match each word to a database of existing valence norms.
Step 2
![]()
If it finds a match, it adds the word to a spectrum visualization, with valence on the x-axis and location on the y-axis.

If it finds a match, it adds the word to a spectrum visualization, with valence on the x-axis and location on the y-axis.
Step 3
![]()
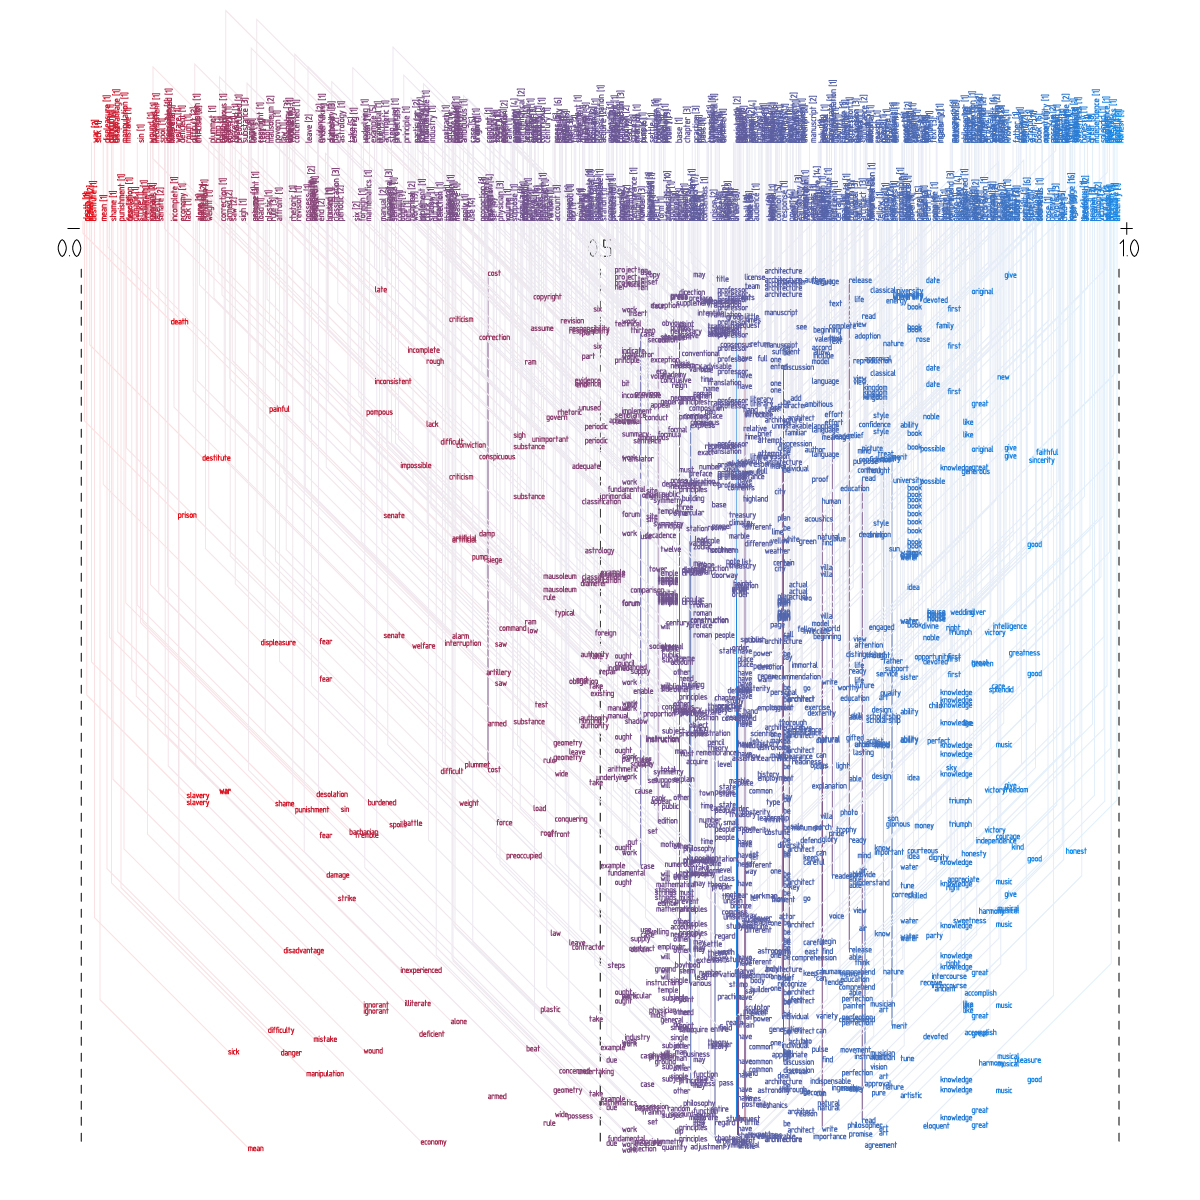
As the software reads further into the corpus, the spectrum densifies to account for the expanded text domain.

As the software reads further into the corpus, the spectrum densifies to account for the expanded text domain.

